
2026-07-08 · nutrition, ultra-processed foods, NOVA, food quality, weight loss, diet quality
Written by Maya Patel
Maya Patel is a WeightFAQ staff writer covering sustainable weight loss through mindful eating, flexible routines, and evidence-based nutrition. She translates research on protein, fiber, portion control, and calorie awareness into practical meal-planning guidance readers can actually follow at home. Her articles favor honest expectations over fad promises — small changes that compound, calorie bands scaled to real households, and grocery lists built around whole foods with room for real life. Maya writes for people juggling family meals, busy weeks, and long-term goals, not gym-optimized single adults with unlimited prep time.
15 min read
Medically reviewed on Jul 8, 2026
Ultra-Processed Foods and Weight Loss: What NOVA, the Hall 2019 Trial, and 20 Cohort Studies Actually Show
Quick answer
Ultra-processed foods (UPF) are industrial formulations built from refined food fragments and cosmetic additives — think sodas, packaged sweet snacks, breakfast cereal bars, flavored yogurts, chicken nuggets, most packaged breads. They are the fastest-growing share of the American diet and now supply roughly 57 percent of daily calories for US adults. In the one well-controlled inpatient trial to date, adults ate about 508 more calories per day and gained 0.9 kg in 2 weeks on an ad-lib UPF diet compared to a nutrient-matched whole-food diet. Long observational cohorts link higher UPF intake to higher body weight, cardiometabolic disease, and mortality, though those associations are confounded and cannot prove causation. You can still lose weight eating some UPF — the calorie rule still governs the scale — but cutting UPF is a real leverage move. This guide covers what the NOVA system means, which foods actually count, and how to cut UPF without going crazy.
Who this is for / not for
This guide is for adults trying to lose or maintain weight who want a practical, evidence-based read on how ultra-processed foods fit in. It is written for a general audience, not for people with active eating disorders, ARFID, or diagnosed orthorexia — for those readers, the framing here can worsen food anxiety and a clinician-led plan should take priority. It is also not for children under two (whose diets are covered by different guidance) or for competitive endurance athletes during training and racing, where fast-absorbing carbohydrate gels and drinks — technically Group 4 — are functionally different from grocery-aisle UPF and should be discussed with a sports dietitian.
The NOVA classification, in one table
NOVA is the food-classification system developed by Carlos Monteiro and colleagues at the University of São Paulo. It groups foods by the extent and purpose of industrial processing rather than by nutrient profile, which is why a flavored 0 percent Greek yogurt and a candy bar can end up in the same tier.
| NOVA group | Examples | What defines the tier |
|---|---|---|
| 1 — Unprocessed / minimally processed | Fresh, frozen, or dried fruit and vegetables; plain frozen fish; eggs; milk; plain yogurt; dried beans, lentils; whole grains, oats, brown rice; plain nuts | Whole foods, or foods altered only by cleaning, drying, freezing, grinding, or pasteurizing. No added ingredients. |
| 2 — Processed culinary ingredients | Olive oil, butter, sugar, salt, vinegar, honey extracted from Group 1 foods | Ingredients used in home kitchens to season and cook Group 1 foods. Not eaten on their own. |
| 3 — Processed foods | Canned tomatoes, canned beans, canned tuna in water, plain cheese, artisan sourdough bread, cured fish, salted nuts, home-style pickles | Group 1 foods preserved with Group 2 ingredients (salt, sugar, oil). Typically 2–3 ingredients you’d recognize. |
| 4 — Ultra-processed | Soda, sweetened yogurts, breakfast cereal bars, chicken nuggets, hot dogs, packaged sliced bread, most breakfast cereals, protein bars, plant-based burgers, packaged cookies, instant noodles, “diet” ready meals | Industrial formulations of substances derived from food (isolated proteins, starches, fats, sugars) plus cosmetic additives (emulsifiers, artificial flavors, colors, non-nutritive sweeteners) you would not find in a home kitchen. |
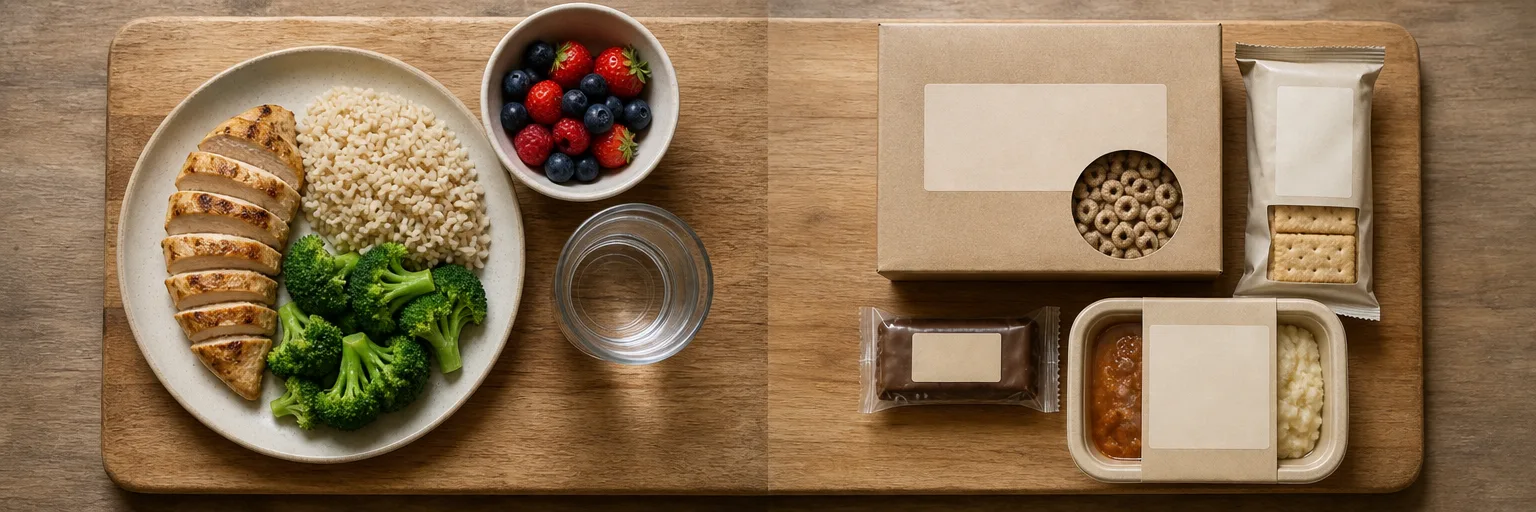
| Where the line actually is | Plain Greek yogurt vs flavored yogurt with modified starch and artificial flavor. Roasted peanuts vs chocolate-coated peanut butter cups. Rolled oats vs a “protein-packed” cereal bar. Fresh chicken breast vs breaded chicken nuggets. Whole-grain flour vs “whole-grain” packaged bread with dough conditioners, emulsifiers, and preservatives. | The same base food can sit in Group 1 or Group 4 depending on what’s been done to it. Read the ingredient list, not the front-of-package claim. |
Why ultra-processed foods drive overeating — four mechanisms
Ultra-processed foods do not have magical properties. They increase intake through four measurable mechanisms, most of which have been demonstrated in controlled feeding studies.
Hyperpalatability and bliss-point engineering. UPF are formulated for maximum sensory reward — combinations of fat, sugar, salt, and soft texture that rarely coexist in whole foods. The neural response looks different from a Group 1 meal: brain-imaging work by Small and DiFeliceantonio (Science 2019) shows that these engineered fat-plus-carb combinations activate reward circuitry more strongly than either fat or carbs alone. Whole foods almost never combine these three axes at the same intensity.
Caloric density and low satiety per calorie. Ultra-processed foods pack more calories into fewer bites. A bowl of oats with berries runs about 1 kcal per gram; a bowl of frosted breakfast cereal with milk is 2 to 3. A homemade chicken-and-vegetable stew is 1 to 1.2 kcal per gram; a frozen pizza is 2.5 to 3.5. Higher caloric density plus lower fiber means you eat more calories before your stomach registers volume.
Fast eating rate. Soft-textured foods increase how many grams per minute you consume. Forde and colleagues (2020) showed that meals engineered for softness are eaten roughly 30 to 45 percent faster than harder-textured, minimally processed equivalents. Faster eating outpaces the ileal-brake and hormonal satiety signals that normally tell you to stop.
Weakened hormonal satiety signaling. The stomach and gut send fullness cues via GLP-1, PYY, and CCK. In controlled feeding studies, ultra-processed meals produce a blunter post-meal rise in these hormones than calorically matched whole-food meals. Combined with faster eating and lower fiber, the biology of “I’m full” arrives later and quieter after a UPF meal — see leptin, ghrelin, and hunger hormones if that page exists in your reading, and the broader set-point theory picture of hormonal defense.
What the evidence actually shows
The UPF literature is younger than most nutrition topics. Its centerpiece is one landmark inpatient trial; the rest is observational, dose-responsive, and consistent but confounded.
The Hall 2019 NIH inpatient RCT (Cell Metabolism). This is the strongest causal evidence in the field. Twenty adults were admitted to the NIH Metabolic Clinical Research Unit for 4 weeks and randomized in a crossover design to two weeks of ad-lib ultra-processed meals followed by two weeks of ad-lib unprocessed meals, or the reverse. The two diets were matched for total calories offered, macronutrient composition, sugar, sodium, fiber, and energy density. On the ultra-processed arm, participants spontaneously ate 508 more calories per day and gained about 0.9 kg in two weeks. On the unprocessed arm they lost about 0.9 kg. This is the only trial to date that isolates “processing” from confounding.
Long observational cohorts. Rico-Campà and colleagues (SUN cohort, BMJ 2019) followed nearly 20,000 Spanish adults for a median of 10 years and found a 62 percent higher all-cause mortality risk per additional daily serving of ultra-processed food. Srour and colleagues (NutriNet-Santé, BMJ 2019) showed higher UPF intake tracked with a 12 percent higher cardiovascular event rate. Fiolet and colleagues (NutriNet-Santé, BMJ 2018) linked a 10 percent increase in UPF share of the diet to a 12 percent higher overall cancer risk. Bonaccio and colleagues (Moli-sani, Am J Clin Nutr 2021) replicated the mortality signal in an Italian cohort. Juul and colleagues (NHANES, Br J Nutr 2018) found each 10 percent increase in UPF share of the US diet tracked with a 0.9 unit rise in BMI.
Systematic reviews and umbrella reviews. Pagliai and colleagues (Br J Nutr 2021) synthesized 43 studies and reported dose-responsive associations with obesity, metabolic syndrome, and mortality. Askari and colleagues (Int J Obes 2020) pooled 23 studies and found ~39 percent higher obesity risk in the highest UPF-intake groups versus the lowest. Lane and colleagues (BMJ 2024) published an umbrella review of UPF and 32 health outcomes and found convincing or highly suggestive evidence for higher risk of cardiovascular disease, common mental disorders, and mortality.
The confounder problem. People who eat more UPF also, on average, smoke more, exercise less, sleep less, earn less, and eat less fiber and produce overall. The meta-analyses adjust for these variables, but residual confounding always survives. This is why the Hall inpatient trial matters so much — it holds most confounders constant. The observational signal is real, reproducible, and dose-responsive, but it should be read as “consistent with harm” rather than “proof of harm.”
Time course of cutting ultra-processed food
| Horizon | What the evidence shows |
|---|---|
| Single meal vs matched whole-food meal | UPF meal eaten ~30–40% faster; blunter post-meal GLP-1/PYY response; ~150–300 extra kcal consumed spontaneously (Forde 2020, Hall 2019 acute data) |
| 24 hours | About 500 kcal higher spontaneous intake on all-UPF vs all-whole-food day (Hall 2019); modestly higher post-meal glucose and insulin excursions |
| 3 days | Palate begins to adjust; unprocessed foods start tasting less bland; hunger patterns start to shift |
| 2 weeks | ~0.9 kg body weight difference in the Hall trial (loss on unprocessed arm, gain on UPF arm) |
| 3 months | Observational cohorts show measurable BMI and waist-circumference improvements at the population level for a 20–40% reduction in UPF share of diet |
| 5 years | Cohort data (SUN, NutriNet-Santé, Moli-sani) show ~10–30% lower cardiovascular event and mortality risk in the lowest-UPF quartile vs highest, with dose-responsive gradient across quartiles |
A 5-step “how to cut UPF without going crazy” protocol
The evidence is clearest at the extremes (0 percent vs 100 percent). The practical target is somewhere in the middle. Aim for roughly 20 percent of daily calories from Group 4 or below, which is where the observational data start showing a durable signal without forcing you into a food-anxiety spiral.
- Swap the top three offenders first. Sugar-sweetened beverages → sparkling water with lime or unsweetened tea. Packaged sweet snacks → an apple with a tablespoon of peanut butter, or a handful of nuts and a piece of fruit. Reconstituted meats (nuggets, hot dogs, most deli meats) → plain roasted chicken, eggs, canned tuna, or unprocessed deli slices. See how to read nutrition labels for the label-reading walkthrough.
- Aim for the 80/20 rule. Roughly 80 percent of daily calories from NOVA Groups 1 to 3, roughly 20 percent from Group 4. That tracks the effect size seen in the observational literature and leaves room for real life — a slice of birthday cake, a takeout dinner, the protein bar you eat between meetings.
- Read the ingredient list, not the front label. The “5-ingredient rule” is a rough proxy, not a hard cut-off. Look for cosmetic additives that flag Group 4 status: hydrolyzed protein, protein isolate, high-fructose corn syrup, invert sugar, maltodextrin, hydrogenated oils, emulsifiers (polysorbate 80, carrageenan, mono- and diglycerides), artificial flavor, artificial color, non-nutritive sweeteners.
- Cook two whole-food anchor meals per week. Frozen shortcuts count — pre-chopped frozen vegetables, pre-washed greens, canned tomatoes, canned beans, and plain frozen fish are Group 1 or Group 3, not Group 4. Two anchor meals a week rebuilds the habit without requiring a full identity shift. See sugar and weight loss for the sugar-cutting side of the same skill.
- Do not quit cold-turkey. Deprivation-driven binges outweigh the modest per-serving harm of a planned treat. A daily “one Group 4 item I actually enjoy” allowance almost always beats a rigid ban that lasts three weeks and collapses.
Treatment comparison: what actually beats UPF
Weight-loss frameworks that reduce UPF exposure — sometimes explicitly, sometimes as a side effect of another rule — differ in effect size and sustainability.
| Approach | UPF exposure | Typical 6-month weight change | Sustainability | Notes |
|---|---|---|---|---|
| Plain whole-food (Group 1–3 default) | Very low | ~5–8% loss | Moderate — requires cooking time | Closest real-world approximation of the Hall unprocessed arm |
| ”Clean-label” reformulated UPF (organic Oreos, “protein” bars, keto snacks) | Still Group 4 | Small (~1–3% loss) or none | High — no cooking | Label change without meaningful composition change |
| Mediterranean diet | Naturally low (~15–25% UPF) | ~5% loss | High — best long-term adherence data | Mediterranean diet — reduces UPF as a side effect |
| DASH diet | Naturally low (~15–25% UPF) | ~4–6% loss | High | DASH diet — sodium target forces UPF cuts |
| Whole30-style elimination | Near zero for 30 days | ~3–5% loss | Low — designed as a reset, not a maintenance plan | Useful for identifying triggers via the 10-day structured reintroduction phase; not sustainable long-term |
| Commercial UPF-heavy weight-loss shake plan | Very high (Group 4 by design) | ~5–10% loss short-term | Low — high regain when shakes stop | Short-term calorie compliance beats food-quality theory in this specific case |
Special situations
Time-poor households and single parents. The realistic Group 1 workaround is a rotating pantry of frozen vegetables, canned beans, canned tomatoes, plain frozen fish, pre-cooked whole grains, and eggs. Total cook time can be under 15 minutes. Frozen vegetables are not ultra-processed. Do not let a UPF-elimination frame push you to skip meals or default to takeout.
On GLP-1 medications. Appetite is already blunted; the hedonic pull of UPF matters less. Prioritize protein (0.5 to 0.8 g per pound of goal body weight) and fiber, and let the medication carry the calorie-restriction work. See GLP-1 weight loss overview for the fuller protocol.
Post-bariatric surgery. UPF is a particular problem in Roux-en-Y gastric bypass, where high-sugar Group 4 items trigger dumping syndrome, and in all bariatric procedures where the shrunken stomach makes it easy to displace protein with dense-calorie sweets. The bariatric post-op nutrition protocol (if this page exists in your reading) covers timing and dose. The dumping syndrome guide covers the UPF triggers directly.
Kids and adolescents. School lunches, screen-time snacking, and birthday-party math dominate childhood UPF exposure. The practical target for families is a “home-food default” — the food available at home is largely Group 1 to 3, and UPF is what happens elsewhere. Rigid at-home rules combined with fun-at-parties tolerance tends to outperform a total ban.
Food-insecure households. UPF often looks like the cheapest option, but on a calories-per-dollar basis dry beans, rice, oats, frozen vegetables, and eggs are still less expensive than most Group 4 alternatives. SNAP-eligible whole foods exist in every category. Telling low-income readers that “real food is expensive” is factually wrong for the Group 1 staples and pushes people into worse choices.
Athletes and endurance training. Intra-workout gels, drinks, and chews are technically Group 4 but functionally different — they are timed to deliver fast-absorbing carbohydrate during exercise when the digestive system cannot handle whole foods. Judge them by timing and total load, not by NOVA tier.
Six ultra-processed-food myths worth refuting
| Myth | Reality |
|---|---|
| ”Every food with more than 5 ingredients is bad.” | The 5-ingredient rule is a rough heuristic. Plenty of Group 1–3 foods exceed 5 ingredients; some Group 4 items have 4. Read for cosmetic additives instead. |
| ”Frozen and canned vegetables are ultra-processed.” | No. Plain frozen and canned vegetables (no added sugar, minimal salt) are Group 1 or Group 3. Freezing and canning preserve nutrients. |
| ”Whole-grain bread is always unprocessed.” | Most packaged sliced whole-grain breads are Group 4 — dough conditioners, emulsifiers, artificial preservatives, added sugar. A whole-grain artisan loaf from a bakery is typically Group 3. |
| ”Ultra-processed food causes weight gain even in a calorie deficit.” | The energy-balance rule holds. UPF makes it harder to stay in a deficit spontaneously, but matched calories produce matched weight change in controlled studies. |
| ”You need to eliminate all UPF to lose weight.” | The Hall trial used 100% vs 0%. Real-world targets of ~20% of calories from Group 4 track the observational signal without a total ban. |
| ”Organic ultra-processed foods (organic Oreos, organic soda) are fine.” | Same palatability engineering, same caloric density, same low satiety per calorie. “Organic” changes the sourcing, not the NOVA tier. |
If UPF avoidance is becoming disordered eating — rigid rituals, panic when only Group 4 options are available, social isolation around eating, or a shrinking list of “acceptable” foods — reach out. The National Eating Disorders Association helpline is 1-800-931-2237, or text NEDA to 741741. Weight-loss frameworks are supposed to make eating easier, not scarier.
Bottom line
Ultra-processed foods are a real leverage point for weight and long-term health, not a moral category. In the one controlled inpatient trial the effect size is meaningful (~500 kcal/day, ~0.9 kg in 2 weeks) and the observational literature is dose-responsive and reproducible across cohorts. But the calorie rule still governs the scale, “clean-label” UPF is still UPF, frozen vegetables are not the enemy, and total elimination is neither necessary nor sustainable. Aim for roughly 20 percent of daily calories from Group 4, swap the top three offenders first, cook two anchor meals a week, and let the rest of your plan — protein target, movement, sleep — do the work. If any of this pushes you toward food anxiety, back off; the tool is not worth the harm. For the broader “how many calories” side of the math, see how many calories to lose weight; for the sweetener side, sugar and weight loss and artificial sweeteners and weight loss; for the whole-diet frame, plant-based weight loss.
Sources
- Hall KD, Ayuketah A, Brychta R, et al. Ultra-processed diets cause excess calorie intake and weight gain: an inpatient randomized controlled trial of ad libitum food intake. Cell Metabolism (2019).
- Monteiro CA, Cannon G, Levy RB, et al. Ultra-processed foods: what they are and how to identify them. Public Health Nutrition (2019).
- Rico-Campà A, Martínez-González MA, Alvarez-Alvarez I, et al. Association between consumption of ultra-processed foods and all cause mortality: SUN prospective cohort study. BMJ (2019).
- Srour B, Fezeu LK, Kesse-Guyot E, et al. Ultra-processed food intake and risk of cardiovascular disease: prospective cohort study (NutriNet-Santé). BMJ (2019).
- Fiolet T, Srour B, Sellem L, et al. Consumption of ultra-processed foods and cancer risk: results from NutriNet-Santé prospective cohort. BMJ (2018).
- Pagliai G, Dinu M, Madarena MP, et al. Consumption of ultra-processed foods and health status: a systematic review and meta-analysis. British Journal of Nutrition (2021).
- Askari M, Heshmati J, Shahinfar H, et al. Ultra-processed food and the risk of overweight and obesity: a systematic review and meta-analysis of observational studies. International Journal of Obesity (2020).
- Lane MM, Gamage E, Du S, et al. Ultra-processed food exposure and adverse health outcomes: umbrella review of epidemiological meta-analyses. BMJ (2024).
- Bonaccio M, Costanzo S, Di Castelnuovo A, et al. Ultra-processed food consumption is associated with increased risk of all-cause and cardiovascular mortality in the Moli-sani Study. American Journal of Clinical Nutrition (2021).
- Juul F, Martinez-Steele E, Parekh N, et al. Ultra-processed food consumption and excess weight among US adults. British Journal of Nutrition (2018).
- Forde CG, Mars M, de Graaf K. Ultra-processing or oral processing? A role for energy density and eating rate in moderating energy intake from processed foods. American Journal of Clinical Nutrition (2020).
- Small DM, DiFeliceantonio AG. Processed foods and food reward. Science (2019).
- Vandevijvere S, Jaacks LM, Monteiro CA, et al. Global trends in ultraprocessed food and drink product sales and their association with adult body mass index. Obesity Reviews (2019).